Live Entertainment Marketing & Revenue Intelligence
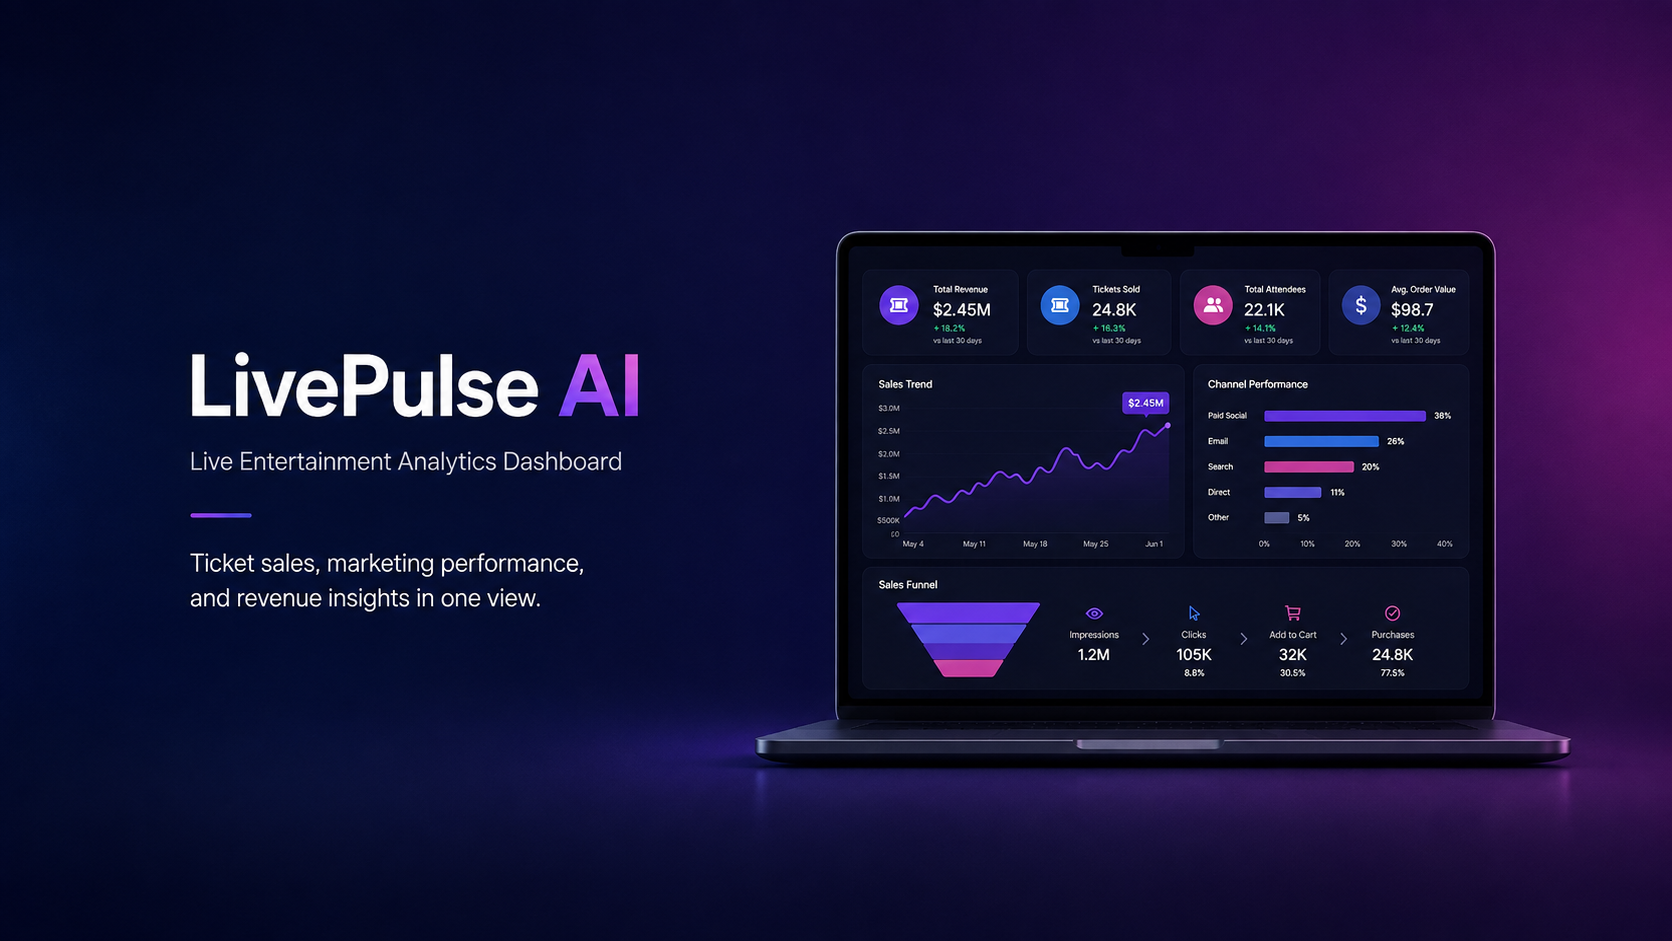
Live entertainment teams have to make decisions quickly. Ticket inventory has a fixed deadline, marketing performance can change week to week, and strong traffic does not always translate into ticket sales.
Tech: Python • SQL • Forecasting • Marketing Analytics • Data Visualization • AI APIs
Problem
Managing performance across multiple events, venues, and marketing channels makes it difficult to see what is actually driving ticket sales.Some of the key questions are:
- Which events are falling behind sales targets?
- Where are customers dropping out of the purchase funnel?
- Which marketing channels are driving efficient conversions?
- Is weak performance caused by traffic, audience quality, or checkout friction?
- Where should the remaining marketing budget be focused?
👉 The challenge is not just reporting performance — it is turning the data into a clear next step.
Solution
I built LivePulse AI, a live entertainment analytics dashboard that brings ticket sales, marketing performance, conversion behavior, and event-level revenue into one view.The project uses synthetic multi-venue data to simulate common business scenarios and show how an analyst could monitor performance, identify risks, forecast ticket demand, and support marketing decisions.The platform is designed around a simple workflow:Monitor performance → diagnose the problem → evaluate options → recommend action
Key Features
1. Ticket Sales & Forecasting
- Tracks sales against expected pace
- Forecasts final ticket sell-through
- Highlights events that may miss capacity or revenue targets
- Shows sales trends as the event date approaches
2. Marketing Funnel Analysis
- Tracks the customer journey from impressions to ticket purchase
- Identifies conversion drop-offs
- Compares performance by channel, device, campaign, and audience
- Helps distinguish traffic problems from conversion problems
3. Channel Performance
- Tracks ROAS, CPA, CPM, CTR, and conversion rate
- Compares performance across paid search, social, email, and retargeting
- Shows which channels are driving traffic versus actual purchases
4. Multi-Event Performance
- Provides an executive view across multiple events and venues
- Compares sales, revenue, marketing efficiency, and risk level
- Supports both individual live events and multi-show productions
5. Budget Scenario Planning
- Tests different marketing budget allocations
- Estimates potential impact on ticket sales and revenue
- Helps evaluate where additional spend may be most effective
6. Executive Summary
- Turns the underlying analysis into a concise business summary
- Highlights key performance changes, risks, and recommended actions
- Provides supporting metrics and assumptions behind each recommendation
About the Data
Because internal entertainment data is not publicly available, I created a synthetic dataset designed around realistic scenarios such as:
- Declining mobile checkout conversion
- High traffic with weak purchase conversion
- Strong search performance with limited budget
- Retargeting saturation
- Underperforming weekday showtimes
The goal of the project is to demonstrate how I approach a business analytics problem — from defining KPIs and structuring the data to identifying performance issues and translating the findings into actionable recommendations.
One-line positioning
Turning ticketing and marketing data into clearer business decisions.